Download HWSim on your smartphone here!
This page shows you what your gain, prize, and return on investment (ROI) are across all money levels—with your biometric data, pounds pledged, and time period held the same. I show this in both graph and list formats.
The idea is to show you how much money you can plow into the wager and maximize your net gain.
There is a soft upper limit to the total investment level, at which net gain (profit, or new money paid out by Healthy Wage) is maximized. If you bet more than this limit, you won’t get any more profit.
At best, the extra money you put in gets pushed back to you when you win your bet—you are essentially loaning money to Healthy Wage for free.
At worst, Healthy Wage starts taking some profit away! It actually costs you profit to bet more money! Don’t do it!

You can edit the biometric and wager inputs here—they will update on all pages within the app.
The Horizontal Zoom Level controls how many values of monthly payments will be shown in the graph and in the list. The graph and list will center on the monthly payment you have selected in the Wager Input section.
For example: if you have chosen a $50/month wager and set the Horizontal Zoom Level to 30, you will see the horizontal axis on the graph go from $36/month to $65/month. The list will show payouts for all wagers from $36/month to $65/month.
Increasing Horizontal Zoom Level will increase the range of wagers. Deceasing it will decrease the range. Setting it to zero will display only the wager selected in Wager Inputs in the graph and in the list.
Gain/Prize/ROI vs Wagered Dollars
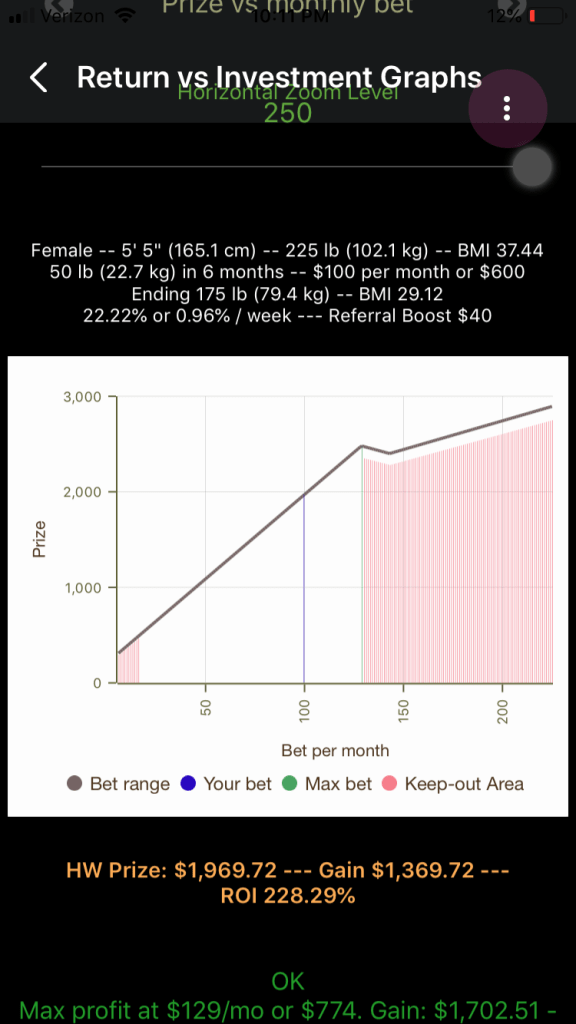
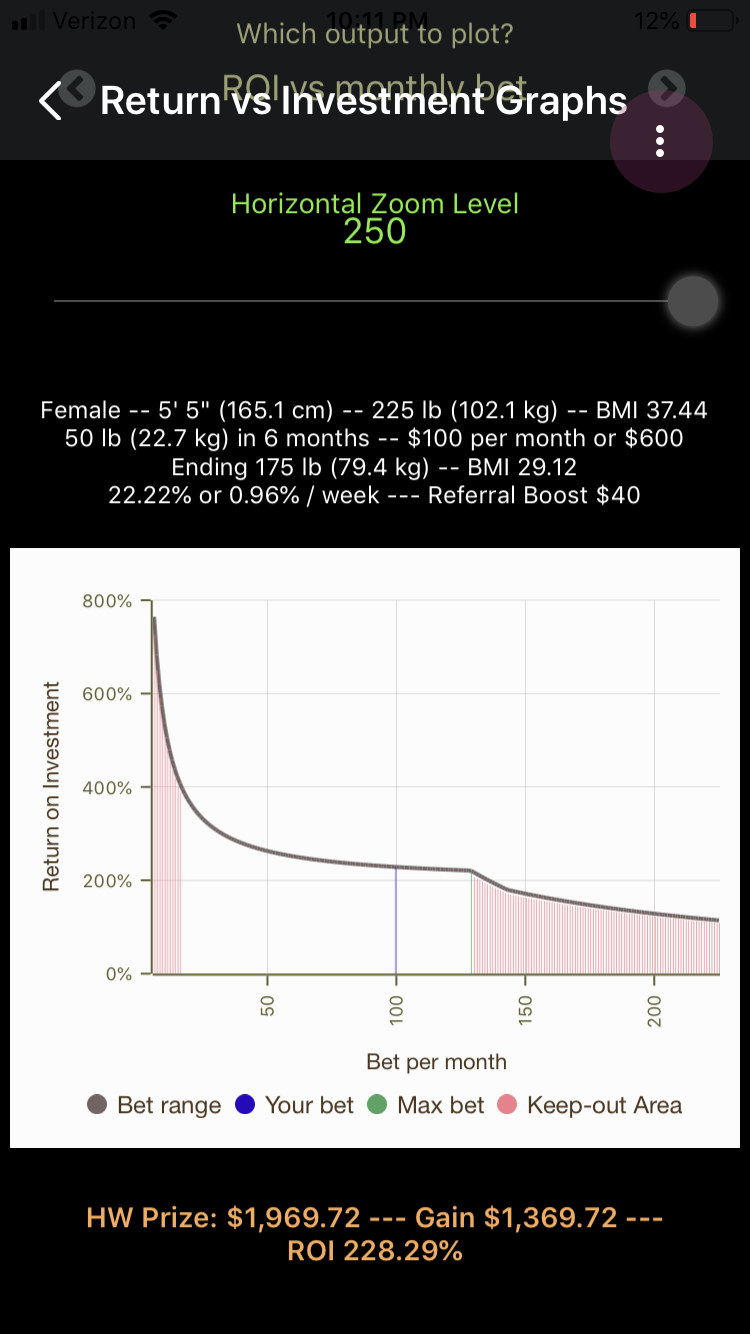
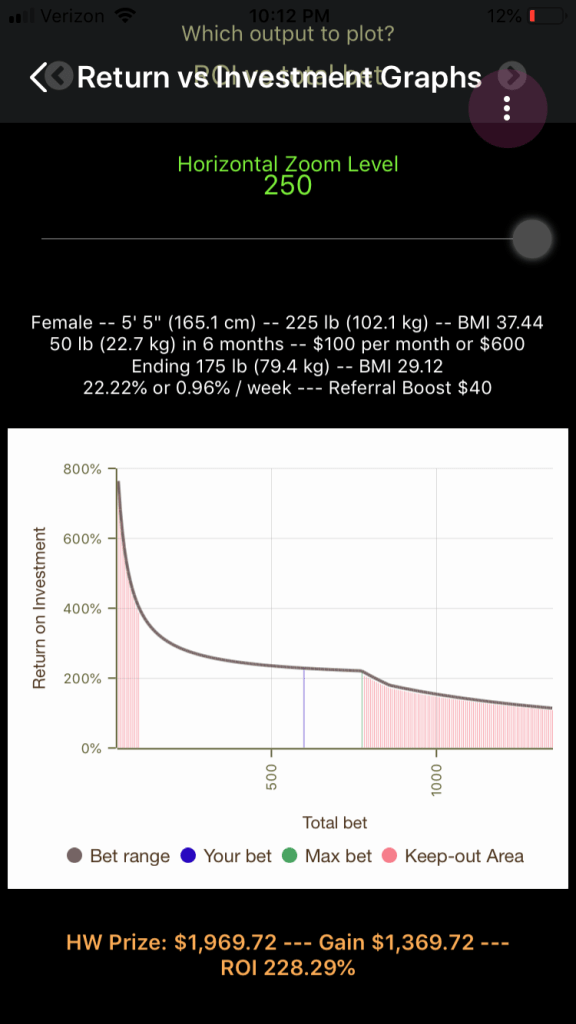
In Which Output to Plot, you can choose to plot gain (profit), prize (profit plus investment), or return on investment percentage (ROI). You can select the horizontal axis to be in monthly dollars or total dollars.

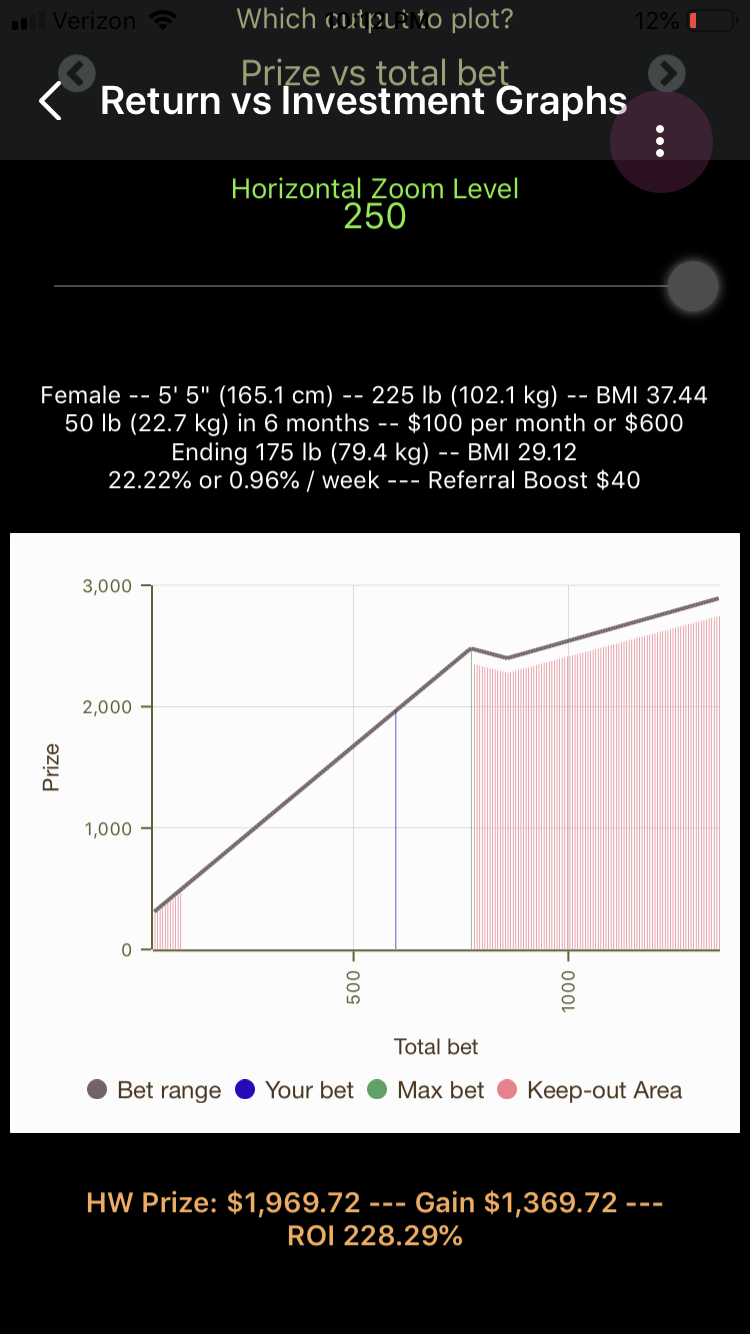
In the graphs:
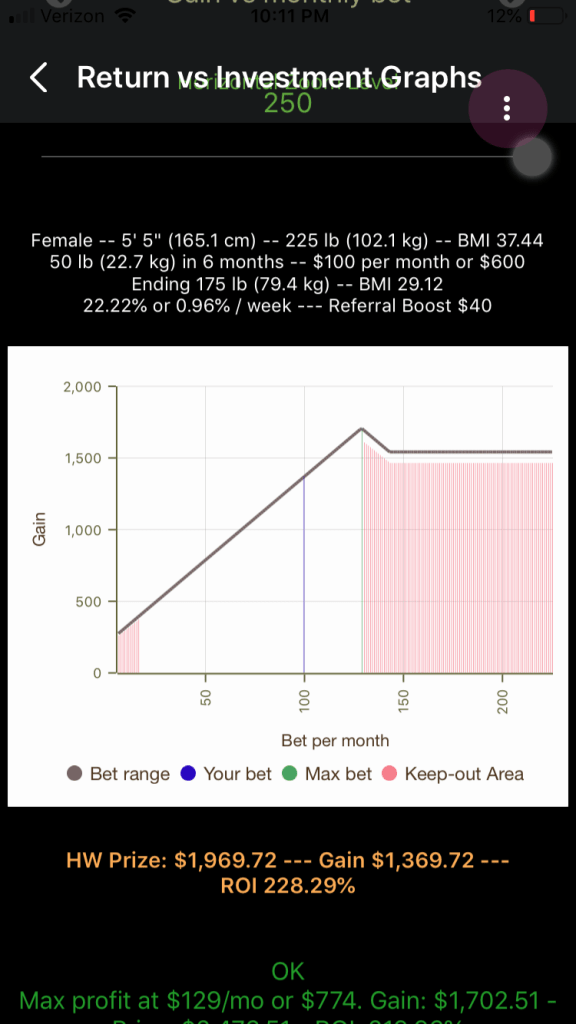
Healthy Wage pays out according to one of two formula types. For less aggressive bets, you are offered a steady ROI on your money up to a certain investment amount. This is what I call the “regular” payout formula. In the first graph above, net gain goes up linearly with investment amount up to a certain point, and then flatlines. The flatline area of the graph is painted in pink, as this is the overbet / sucker bet area that you need to stay out of.
For more aggressive bets, you are offered a profit of 194.12% of your investment, plus a bonus that goes up linearly with pounds pledged (but is independent of investment size). This is the “triple-bonus” payout formula.
- The black line shows the net gain, prize, or ROI as a function of wager amount.
- The blue bar shows the net gain, prize, or ROI associated with the wager inputs you have chosen at the top of the page.
- The green bar shows the maximum net gain available and the investment amount corresponding to it. If prize or ROI is chosen in the display controls, that output associated with net gain is shown in the graph.
- The pink area shows areas that you either cannot bet in, or should avoid betting in. These “keep-out” zones are triggered by the following conditions:
- Pledged pounds less than 10% of bodyweight (not allowed—if this is the case for the wager inputs you have entered, the entire graph will be a keep-out zone)
- Total wager under $100 (e.g. under $17/month for a 6-month wager) (not allowed)
- Too much money is being bet, causing a profit cap to be breached and net gain to be stunted
- Too many pounds pledged in too little time, causing weekly weight loss to exceed 1.5% (this makes the entire graph a keep-out zone)
- Too many pounds pledged, causing ending BMI to fall under 18 (this makes the entire graph a keep-out zone)
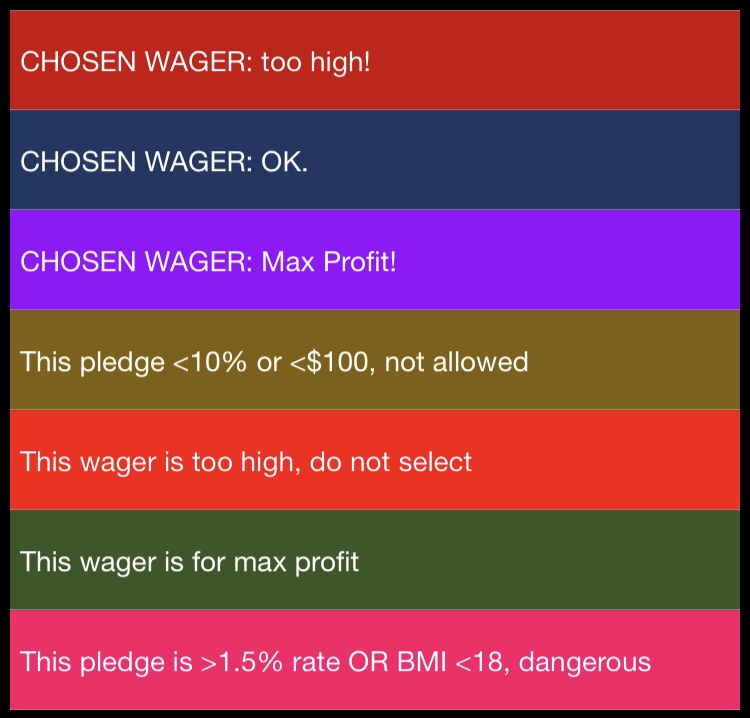
Wager outputs and flags
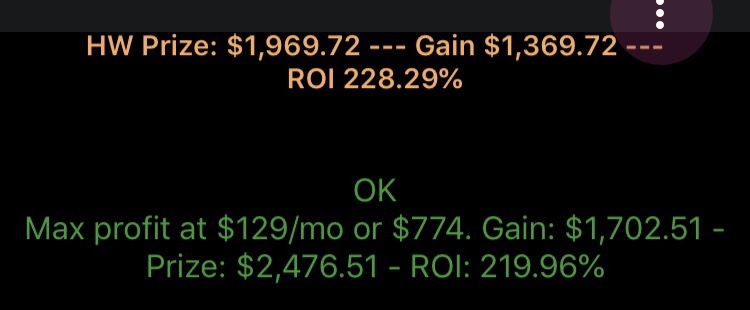
This tells you the prize, gain, and ROI for the wager you have selected.
If the wager is illegal (under 10% or under $100$, you won’t see the prize figures shown.
Otherwise, if the wager is not recommended due to being too large (busting a net gain cap), or too fast (weekly loss rate above 1.5%, or too extreme (BMI under 18 at the end, you’ll see pink text telling you this.
But if the wager is otherwise “OK”, you’ll see green text. The “maximum profit” investment level will be given to you here—assuming that you leave pledged pounds the same.
List of Outputs with Varying Wagered Dollar Amounts

At the bottom you will see a list of prize, gain, and ROI for the sweep of wager amounts you have selected. These correspond to the values shown in the graph.
Note the color coding for the different values. Generally, shades of red are Not Recommended due to being too much money, or too many pounds pledged, or too many pounds in too little time. The yellow shades are for illegal bets (under 10% or under $100 bet across all months).