
This post with show you one way that wager profit can be shown in HWSim.
This is on the Return vs Wagered Dollars Page—when you know how many pounds you want to lose and how many months you will do it in, and want to maximize your profit.


If the bet exceeds $66 per month, the $158 is phased out as the bet increases. After the phase-out is complete, the profit flatlines at $16 per pound for 80 pounds or $1,280.
The profits are smaller than for Yellow wagers, but there is an excellent trade off between ease of wager and profit between the Purples and Yellows. But if the man reduces the Purple wager by one pound (keeping time the same), the new payout will conform to the Green payout formula and will be substantially less.
You’ll notice that for all three of the “good” colors—green, yellow, and purple—the profit goes up linearly with bet size.
For the Green wagers, which are more moderate wagers in the judgment of Healthy Wage, your profit is equal to your bet, multiplied by some percentage between 11.1% and 194.12%—in the example, it is 141.49%. The more pounds you pledge, the more profit you are allowed to try for. The maximum profit achievable is indicated in Bright Green, and it is associated with a maximum bet size. If you bet more than this, the wager turns Red, which indicates you are betting money unnecessarily and getting no additional profit. In the graph above you see how the profit flatlines in the Red zone.
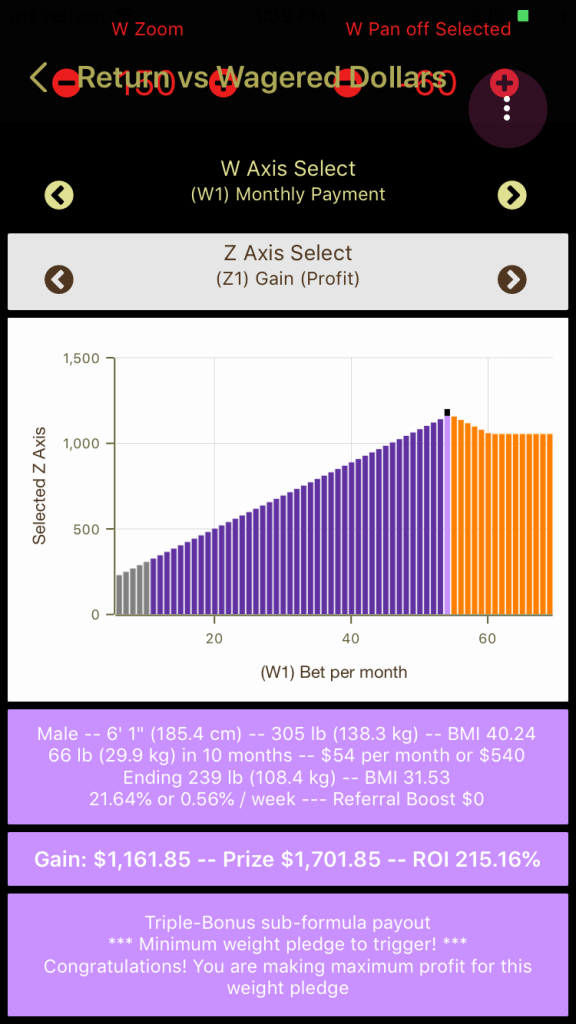
For the Purple and Yellow wagers, your profit is 194.12% of your bet, plus a flat bonus that is dependent on your pounds pledged. Again, the more pounds you pledge, the more profit you are allowed to try for. The maximum profits are indicated with Bright Purple and Bright Yellow.
The Betting too much for a Purple pledge turns that wager Orange. For a Yellow pledge, betting too much turns it Crimson. In either case, you are not only getting no additional profit for that extra money you are risking—you are actually forfeiting some or all of that pledge-dependent bonus. In the graphs above you can see how the profit decreases and then flatlines in the Orange and Crimson zones.
The Z1 Profit metric can be plotted against both W1 (monthly payment) and W2 (total payment).
Also check out the following metrics:
- Z2 Prize
- Z3 Return on Investment
- Z4 Bet-Multiplied Component of Gain (the part of gain that is dependent on bet size—this is all of the profit awarded on a Green wager, and 194.12% of the bet for a Purple or Yellow wager
- Z5 Bonus Component of Triple-Bonus Gain (the flat bonus in a Purple or Yellow wager; zero for a Green wager)
- Stack-up of Gain (consists of bet-dependent part, bonus part, and referral boost
- Stack-up of Prize (same as the Stack-up of Gain, but including your bet in the stack-up)
