
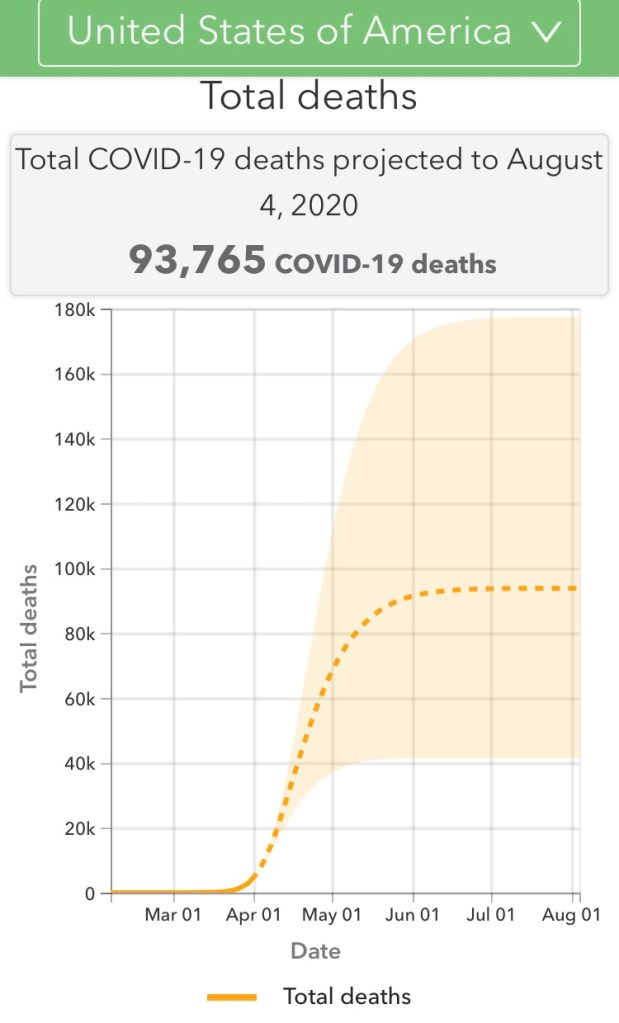
Well, shit. That went up about 10,000 since yesterday.
Then:

So according to these models, to get this rather grim result, all 50 states need to start hunkering down this week if they haven’t already—and they have to keep doing so for another month AFTER the White House guidelines expire. And there should be travel restrictions in place as well.
That is discouraging news. But I think it’s partially bullshit.
I have looked at their death projections over time, and the patterns they show don’t make sense—particularly after each state gets past their apexes and starts coming down.
While I do believe we have to do this hard mitigation for 30 days, I also believe that we will be in a good position to ease things up, starting in May. I will explain my reasoning here.
First, check this out:
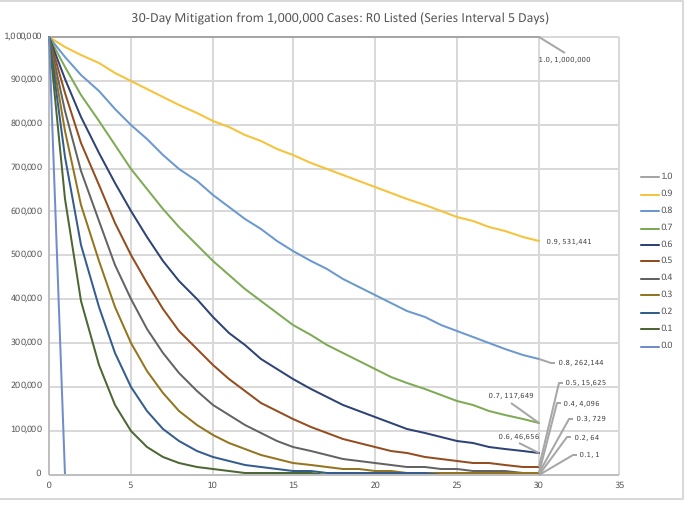
This is an illustration of what hard mitigation can do for us this month.
Let’s assume there are 1 million people in the US right now that have active corona and can pass this on to people who do not. Don’t worry about how they are distributed throughout the country for this assumption—it’s not important.
Also assume that the serial interval of the virus is 5 days. That is, when it is said that one person passes the disease to 2 people or 2.5 people or 3 people (the R0 or R-naught), the median amount of time this will occur in is 5 days. This paper estimates what the serial interval is, but it could be anywhere between 4 and 7 days.
With R0 = 2, the number of active cases doubles every 5 days; with R0 = 3, it triples over that same period. Over the course of a month, you will have 6 serial intervals. If R0 = 2 over that time, your cases will grow 2^6 or 64-fold. With R0 = 3, they grow 3^6 or by a factor of 729.
When you do mitigation, you lower the R0 to below 1—and you get it as low as you possibly can. If R0 is 1, then the number of cases stays the same indefinitely, because each person infects one other person. But if R0 = 0.5, the number of cases drops by half every 5 days, or by 98.44% over the course of 30 days.
The graph below shows how different levels mitigation can attenuate the extant cases over the course of a month, starting with 1,000,000 active cases.

It appears that an effective R0 between 0.3 and 0.5 is realistically possible, according to analyst Tomas Pueyo in an interview with Indian media. So we have a chance to make ourselves “99-44/100 % pure” this month. That would be an R0 of 0.42 throughout the month.
Do we have 1,000,000 active cases in the US now? I think that’s not too far off. Officially, we have 177,000 cases today, which were tested. Most people who get symptoms stay home to wait it out, rather than going in to get tested. The people with severe symptoms go in and get tested, typically.
Having about 20% officially infected seems about right to me. I estimated yesterday about 748,000 active cases, simply by multiplying the number of deaths that day by 1,000 (Pueyo figured an 800 multiplied in his first viral Medium paper).
If we get down to about 10,000 cases by the end of April, we can ease up on mitigationM so that the case load doesn’t grow—we just need to keep R0 below 1. By then, we should have substantially better testing and tracking capability online. This is Pueyo’s “dance” following the April “hammer.”
But the IHME model says we need to keep hard mitigation up through May. Here’s where I’m calling bullshit on that.
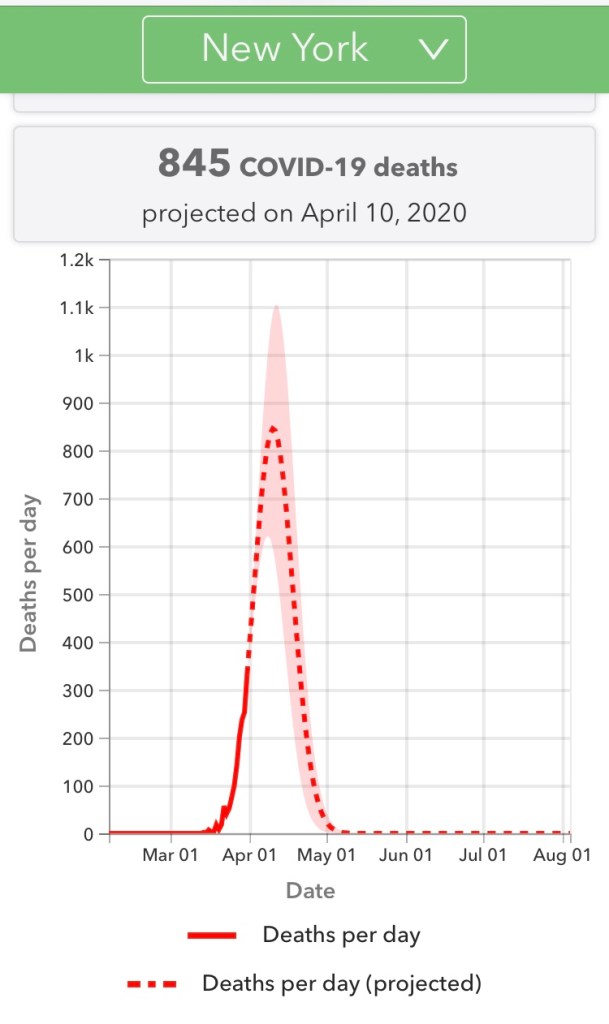
Here’s the projected daily mortality in New York State according to IHME. The solid line is actual up to today. The dashed line is average projection, and the boundaries of the shaded area are minimum and maximum. They are projected to peak on Good Friday, April 10.

This is the average historical projections for 3/25, 3/29, 3/30, and 3/31. They are getting updated every day now, as new data comes in.
Notice how those peaks are symmetrical. They rise to their apex and then fall at the same rate. By April 30, mortality is under 50, and by 5/6 it is zero.
Based on my understanding of how death lags contraction of the virus by a few weeks, and how the math works with exponential growth and attenuation, the symmetrical projection looks wrong.
This is what I’d expect to see:
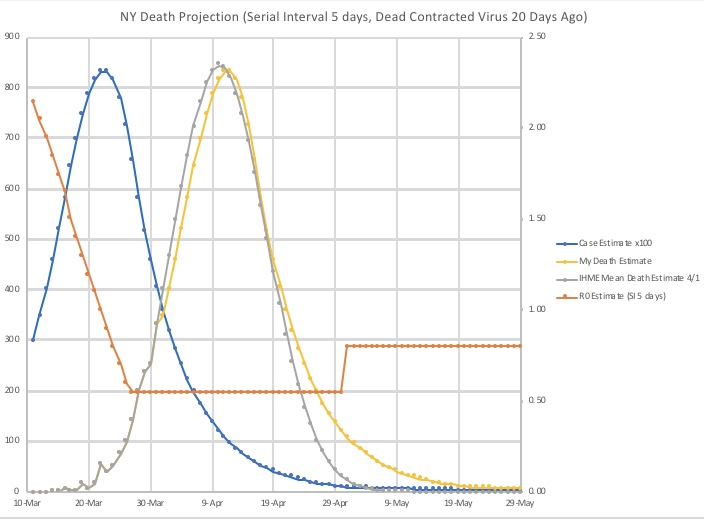
The gray line is the IHME average model from 3/31 for New York State. The yellow is my scientific wild-ass guess of what it might be realistically.
Note how the right tail of that yellow is spread out. At the end of April, the deaths taper off at a slower rate than what IHME has assumed.
Here are my assumptions:
- There were approximately 300 deaths in New York on 3/31 (a rough average of 3/30 and 3/31 recorded official mortality)
- The true fatality rate of Covid-19 is 1%
- The 300 all picked up the bug 20 days earlier, on 3/11—coincidentally, the day of the Trump Oval Office address and the NBA shutting down, when “shit started getting real.” With a 1% fatality rate, I am estimating there to have been 30,000 active cases of corona in New York on 3/11
- I made estimations for what R0 was for 3/11 and each day following. The orange line shows this. It was 2.15 on 3/11 and started dropping as people slowly began to comprehend the problem and moved toward slowing the growth, and then mitigating.
- The serial interval (SI) is 5 days. For each day, the equivalent growth or attenuation rate is equal to R0^(1/SI), or the R0^(1/5). On 3/11, with R0 = 2.15, the number of active cases grew 2.15^0.2 – 1 or about 16%—or 34,963.
- After 3/11, with increasing social distancing and restrictions, R0 went down. I have it dropping to 1 on 3/22, the day Cuomo enacted shelter in place. It then settled to 0.55 by 3/28, where I have it remaining through today and onward through the end of April.
- You see the active case load rise and then peak at about 83,000 cases by 3/22, and 3/23 and then start to drop. (Note that official reported cases lag contraction of the virus, and not everybody who gets symptoms goes to get tested.
- Subsequent mortality lags cases by 20 days, and is 1% of cases. So there are 830 people dying on 4/11 and another 830 dying on 4/12 (Easter Weekend, coincidentally).
- With mitigation in effect starting on 3/22 and ramping up to the 0.55 level by 3/28, the resultant case load and mortality are shown. Both taper off with fairly wide tails. By 5/1, there are 999 active cases in New York, and on 5/21 the state will lose about 10 of them. People will continue to die in May and June, but starting on 5/15 you need only 1 hand to count them each day.
- On 5/1, mitigation restrictions ease up. Large gatherings are still prohibited, but people are allowed to work as long as they keep their hands clean and perhaps wear masks. I assumed that R0 rises to 0.8. So New York is still mitigating. Meanwhile, new cases are closely monitored so that any budding local outbreaks are suppressed.
It seems that the IHME model assumes that mitigation is perfect or as close to it as possible (R0 = 0.1 or less), based on the shape of their right tail.
Meanwhile, other states that are not hotspots right now look like this:

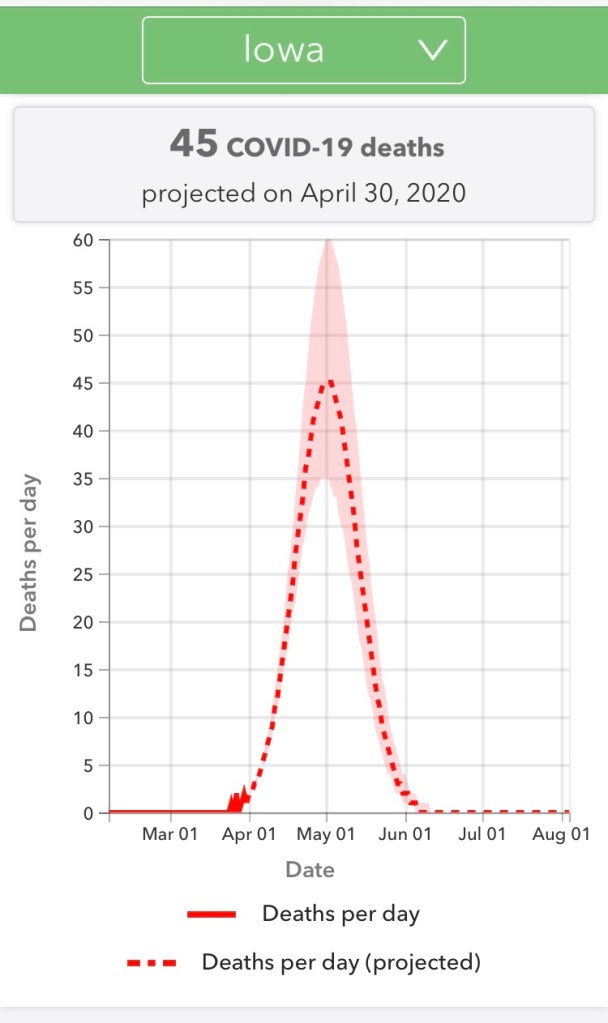
They look like New York—that same symmetrical rise and fall—except that they are shifted rightward in time and they have different magnitudes. The model assumes that these states will be hotspots in May, just like New York and a few others—and therefore everybody has to hunker down until all 50 states have withstood their respective surges.
Of course, many of these states had very little Covid in them in late March and some have very little even today. Yet they are all mitigating to some extent at this point. As far as spread control is concerned, they probably don’t need to do shelter-in-place. But for national political reasons I believe it is best that they should.
The White House Task Force, particularly Drs Fauci and Birx, drove home the point that preventing hotspot emergence was possible for large parts of the country at this point.
Indeed, it is very important for these areas to stay vigilant during this month. Many people are fleeing hotspot areas. If people aren’t careful, they can be susceptible to contracting the virus from people who are importing it. New Yorkers are migrating to Florida and upper New England. In Michigan, I am thinking of Detroiters who decide to head up north to their cottages. I hope they shelter in place up there as much as they possibly can.
More to come in a later post. For now, stick with the plan.
